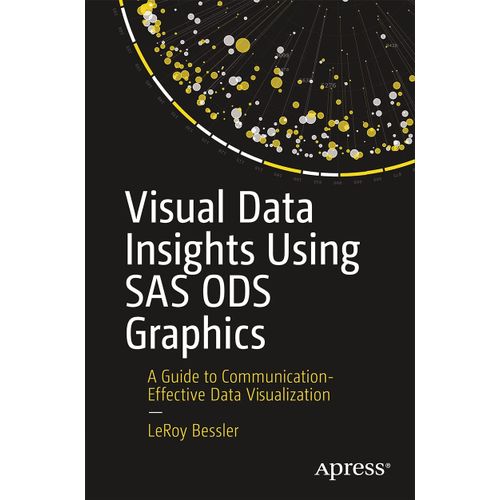

Visual Data Insights Using SAS ODS Graphics - Bessler, Leroy
- Format: Broché
- 644 pages Voir le descriptif
Vous en avez un à vendre ?
Vendez-le-vôtreExpédition rapide et soignée depuis l`Angleterre - Délai de livraison: entre 10 et 20 jours ouvrés.
Nos autres offres
-
81,04 €
Produit Neuf
Ou 20,26 € /mois
- Livraison à 0,01 €
Nouvel article expédié dans le 24H à partir des Etats Unis Livraison au bout de 20 à 30 jours ouvrables.
-
80,11 €
Produit Neuf
Ou 20,03 € /mois
- Livraison : 3,99 €
- Livré entre le 30 juillet et le 1 août
-
107,71 €
Produit Neuf
Ou 26,93 € /mois
- Livraison : 5,00 €
- Livré entre le 28 et le 31 juillet
Exp¿di¿ en 6 jours ouvr¿s
- Payez directement sur Rakuten (CB, PayPal, 4xCB...)
- Récupérez le produit directement chez le vendeur
- Rakuten vous rembourse en cas de problème
Gratuit et sans engagement
Félicitations !
Nous sommes heureux de vous compter parmi nos membres du Club Rakuten !
TROUVER UN MAGASIN
Retour

Avis sur Visual Data Insights Using Sas Ods Graphics Format Broché - Livre Informatique
0 avis sur Visual Data Insights Using Sas Ods Graphics Format Broché - Livre Informatique
Donnez votre avis et cumulez 5
Les avis publiés font l'objet d'un contrôle automatisé de Rakuten.
-

Original Morgan 4/4, Plus 4 And Plus 8
1 avis
Occasion dès 59,99 €
-

Tom Waits By Matt Mahurin
Occasion dès 47,16 €
-

Manual Of Cardiac Care In Children
Neuf dès 82,10 €
Occasion dès 249,99 €
-

Cutaneous Adnexal Tumors
Neuf dès 82,10 €
-

The Books Of Albion: The Collected Writings Of Peter Doherty
Occasion dès 59,99 €
-

Pierre Grandet Et Bernard Mathieu - Cours D'égyptien Hiéroglyphique - Tome 1 - Editions Khéops -1990
Occasion dès 42,00 €
-

The Art And Soul Of Dune
Neuf dès 63,55 €
-

Nudes And Portraits
Occasion dès 63,44 €
-

Master Techniques In Surgery: Thoracic Surgery: Transplantation, Tracheal Resections, Mediastinal Tumors, Extended Thoracic Resections
Neuf dès 52,91 €
-

Avedon At Work
1 avis
Neuf dès 71,15 €
Occasion dès 77,33 €
-

Pith Instructions For A-Tri Dzogchen (Revised Edition)
Neuf dès 45,85 €
Occasion dès 62,99 €
-

Keba Keba
Occasion dès 87,89 €
-

Physiology Of The Heart
Neuf dès 52,91 €
Occasion dès 98,78 €
-

Stochastic Processes And Integration
Neuf dès 44,61 €
-

Musculoskeletal Mri
Neuf dès 44,61 €
-

Trail Guide To The Body
Neuf dès 44,61 €
-

Khonsari's Cardiac Surgery
Neuf dès 44,61 €
Occasion dès 474,99 €
-

Meyers' Dynamic Radiology Of The Abdomen
Neuf dès 44,61 €
Occasion dès 285,99 €
-

Cricut Joy
Neuf dès 51,50 €
Occasion dès 100,00 €
-

Beethoven: Complete String Quartets, Transcribed For Four-Hand Piano, 2 Series
Occasion dès 52,99 €
Produits similaires
Présentation Visual Data Insights Using Sas Ods Graphics Format Broché
- Livre InformatiqueAuteur(s) : Bessler, LeroyEditeur : ApressLangue : AnglaisParution : 01/01/2023Format : Moyen, de 350g à 1kgNombre de pages : 644Expédition : 961Dimensions : 23.5 x 15.5 x 3.5 ...

Résumé : SAS ODS graphics users will learn in this book how to visually understand and communicate the significance of data to deliver images for quick and easy insight, with precise numbers. Many charts or plots require the viewer to run the eye from a bar end or plot point to some point on an axis, and then to interpolate between tick marks to estimate the value. Some design choices can lead to wrong conclusions or mistaken impressions. Graphic software relies on defaults to deliver something if you make a minimal effort, but that something is not likely to be exactly what you want. Visual Data Insights Using SAS ODS Graphics provides examples using experience-based design principles. It presents examples of bar charts, pie charts, and trend lines or time series plots, the graph types commonly used in business, other organizations, and the media for visual insight into data. Newer graphs are also included: dot plots, needle plots, waterfall charts, butterfly charts, heat maps, bubble plots, step plots, high-low plots, and donut charts. In addition, there are basic tools of statistics: scatter plots, box plots, histograms, fit and confidence plots, and distributions. Author LeRoy Bessler introduces unique creations, including sparsely annotated time series, maximally informative bar charts, better box plots, histograms based on interesting atypical rationales, and much more. The examples use SAS sample data sets as input. Any SAS user can experiment with the code presented to see what else is possible, or adapt it to repurpose the design and apply it with a customized version of that code. What You'll Learn Who This Book Is For SAS software users who want to understand their data and/or visually deliver their results
Biographie: LeRoy Bessler has been a devotee of computer graphics tools in SAS since 1981, and is an award-winning, internationally recognized expert on data visualization. He has been on a continuing quest to find and promote best graphic designs and practices for delivering visual data insights. His book is a long-in-the-making and gradually evolved guiding compendium of his design principles for communication-effective data visualization, with widely applicable examples. He shares his SAS software knowledge, experience, and ideas at conferences in the USA and overseas, and contributes quarterly articles to the VIEWS Newsletter for SAS users.
Détails de conformité du produit
Personne responsable dans l'UE
