
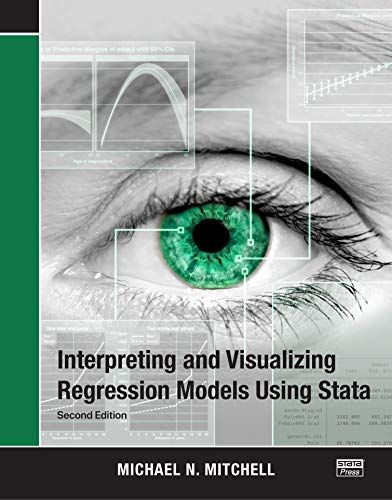
Interpreting and Visualizing Regression Models Using Stata - Michael N. Mitchell
- Format: Broché Voir le descriptif
119,91 €
Produit Neuf
Ou 29,98 € /mois
- Livraison : 3,99 €
- Livré entre le 18 et le 25 septembre
Nos autres offres
-
152,31 €
Produit Neuf
Ou 38,08 € /mois
- Livraison à 0,01 €
Nouvel article expédié dans le 24H à partir des Etats Unis Livraison au bout de 20 à 30 jours ouvrables.
Voir le détail de l'annonce -
213,29 €
Produit Neuf
Ou 53,32 € /mois
- Livraison à 0,01 €
Expédition rapide et soignée depuis l`Angleterre - Délai de livraison: entre 10 et 20 jours ouvrés.
Voir le détail de l'annonce

- Payez directement sur Rakuten (CB, PayPal, 4xCB...)
- Récupérez le produit directement chez le vendeur
- Rakuten vous rembourse en cas de problème

Gratuit et sans engagement
Félicitations !
Nous sommes heureux de vous compter parmi nos membres du Club Rakuten !
TROUVER UN MAGASIN
Retour
Avis sur Interpreting And Visualizing Regression Models Using Stata de Michael N. Mitchell Format Broché - Livre Science humaines et sociales, Lettres
0 avis sur Interpreting And Visualizing Regression Models Using Stata de Michael N. Mitchell Format Broché - Livre Science humaines et sociales, Lettres
Les avis publiés font l'objet d'un contrôle automatisé de Rakuten.
-
Behind Bars: The Definitive Guide To Music Notation
Neuf dès 101,68 €
-
Sf2a : Scientific Highlights 2004
Occasion dès 69,00 €
-
By Marc Pairon Art Deco Ceramics Made In Belgium: Charles Catteau
6 avis
Occasion dès 110,00 €
-
Geometric Quantization And Quantum Mechanics
Neuf dès 123,61 €
-
Harald Szeemann
Neuf dès 87,99 €
-
Flashpoint: The 10th Anniversary Omnibus
Neuf dès 158,08 €
-
The Fourth World Omnibus Vol. 2
Neuf dès 134,88 €
-
The Globalization Of World Politics
Neuf dès 87,03 €
-
I: Functional Analysis
Occasion dès 82,70 €
-
Quantum Mechanics
Occasion dès 65,00 €
-
Angry Women (Re/Search ; 13)
Occasion dès 113,99 €
-
The Big Book Of B Movies
Occasion dès 96,20 €
-
Advanced Quantum Mechanics
Neuf dès 145,54 €
-
The Rainbow
Neuf dès 105,43 €
-
Motor Racing - Reflections Of A Lost Era
Neuf dès 63,37 €
-
Joseph Beuys Multiples: Catalogue Raisonné Of Multiples And Prints 1965-1985
Occasion dès 100,00 €
-
Microeconomic Theory
Occasion dès 69,86 €
-
The Beauty Of Kinbaku: (Or Everything You Ever Wanted To Know About Japanese Erotic Bondage When You Suddenly Realized You Didn't Speak Japan
Neuf dès 67,36 €
-
Rules, Patterns And Words
Neuf dès 80,00 €
-
Ouragan: 30 Siècles De Vies Communes (French Edition)
3 avis
Occasion dès 79,89 €
Produits similaires
Présentation Interpreting And Visualizing Regression Models Using Stata de Michael N. Mitchell Format Broché
- Livre Science humaines et sociales, Lettres


Résumé : Interpreting and Visualizing Regression Models Using Stata, Second Edition provides clear and simple examples illustrating how to interpret and visualize a wide variety of regression models. Including over 200 figures, the book illustrates linear models with continuous predictors (modeled linearly, using polynomials, and piecewise), interactions of continuous predictors, categorical predictors, interactions of categorical predictors, and interactions of continuous and categorical predictors. The book also illustrates how to interpret and visualize results from multilevel models, models where time is a continuous predictor, models with time as a categorical predictor, nonlinear models (such as logistic or ordinal logistic regression), and models involving complex survey data. The examples illustrate the use of the margins, marginsplot, contrast, and pwcompare commands. This new edition reflects new and enhanced features added to Stata, most importantly the ability to label statistical output using value labels associated with factor variables. As a result, output regarding marital status is labeled using intuitive labels like Married and Unmarried instead of using numeric values such as 1 and 2. All the statistical output in this new edition capitalizes on this new feature, emphasizing the interpretation of results based on variables labeled using intuitive value labels. Additionally, this second edition illustrates other new features, such as using transparency in graphics to more clearly visualize overlapping confidence intervals and using small sample-size estimation with mixed models. If you ever find yourself wishing for simple and straightforward advice about how to interpret and visualize regression models using Stata, this book is for you.
Biographie:
Continuous predictors: Linear...
Sommaire: Introduction...
Détails de conformité du produit
Personne responsable dans l'UE