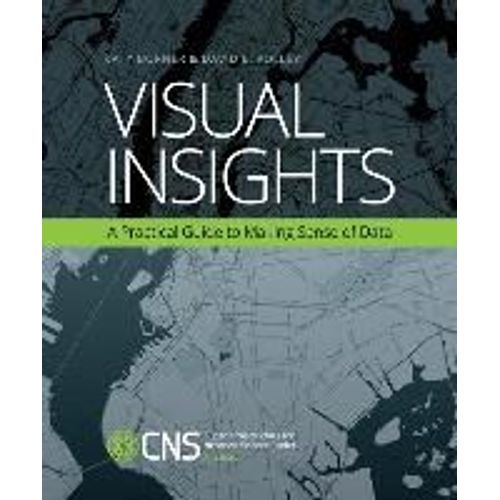

Visual Insights: A Practical Guide to Making Sense of Data - Katy Börner
- Format: Broché
- 297 pages Voir le descriptif
Vous en avez un à vendre ?
Vendez-le-vôtreExpédition rapide et soignée depuis l`Angleterre - Délai de livraison: entre 10 et 20 jours ouvrés.
Nos autres offres
-
70,94 €
Produit Neuf
Ou 17,74 € /mois
- Livraison à 0,01 €
Nouvel article expédié dans le 24H à partir des Etats Unis Livraison au bout de 14 à 21 jours ouvrables.
- Payez directement sur Rakuten (CB, PayPal, 4xCB...)
- Récupérez le produit directement chez le vendeur
- Rakuten vous rembourse en cas de problème
Gratuit et sans engagement
Félicitations !
Nous sommes heureux de vous compter parmi nos membres du Club Rakuten !
TROUVER UN MAGASIN
Retour

Avis sur Visual Insights: A Practical Guide To Making Sense Of Data de Katy Börner Format Broché - Livre
0 avis sur Visual Insights: A Practical Guide To Making Sense Of Data de Katy Börner Format Broché - Livre
Donnez votre avis et cumulez 5
Les avis publiés font l'objet d'un contrôle automatisé de Rakuten.
Présentation Visual Insights: A Practical Guide To Making Sense Of Data de Katy Börner Format Broché
- LivreAuteur(s) : Katy Börner - David E. PolleyEditeur : Mit PrLangue : AnglaisParution : 01/01/2014Format : Moyen, de 350g à 1kgNombre de pages : 297Expédition : 725Dimensions : 22.8 x 18.9 x...

Résumé : In the age of Big Data, the tools of information visualization offer us a macroscope to help us make sense of the avalanche of data available on every subject. This book offers a gentle introduction to the design of insightful information visualizations. It is the only book on the subject that teaches nonprogrammers how to use open code and open data to design insightful visualizations. Readers will learn to apply advanced data mining and visualization techniques to make sense of temporal, geospatial, topical, and network data. The book, developed for use in an information visualization MOOC, covers data analysis algorithms that enable extraction of patterns and trends in data, with chapters devoted to when” (temporal data), where” (geospatial data), what” (topical data), and with whom” (networks and trees); and to systems that drive research and development. Examples of projects undertaken for clients include an interactive visualization of the success of game player activity in World of Warcraft; a visualization of 311 number adoption that shows the diffusion of non-emergency calls in the United States; a return on investment study for two decades of HIV/AIDS research funding by NIAID; and a map showing the impact of the HiveNYC Learning Network. Visual Insights will be an essential resource on basic information visualization techniques for scholars in many fields, students, designers, or anyone who works with data.
A guide to the basics of information visualization that teaches nonprogrammers how to use advanced data mining and visualization techniques to design insightful visualizations.
Biographie:
Katy B?rner is Victor H. Yngve Professor of Information Science, Leader of the Information Visualization Lab, and Founding Director of the Cyberinfrastructure for Network Science Center at Indiana University Bloomington. She is the author of Atlas of Science: Visualizing What We Know and the coauthor of Visual Insights: A Practical Guide to Making Sense of Data, both published by the MIT Press.
David E. Polley is on the research staff at the Cyberinfrastructure for Network Science Center at Indiana University.
Détails de conformité du produit
Personne responsable dans l'UE
